You are paying shoppers who would have bought anyway
Most promotions look profitable because the ROI maths quietly ignores the baseline. Here is the calculation that separates volume you bought from volume you already had.

Here is a promotion that looks like a win. Normal week: 12,000 units at RM 10.00, RM 4.00 of gross margin each. Campaign week: 25 percent off, and units jump to 20,000. Units up 67 percent, the buyer is happy, the category manager wants a repeat next month.
Now do the calculation almost nobody does.
The two questions that decide every promotion
First, how many of those units were incremental? You sold 20,000. You would have sold 12,000 anyway. Only 8,000 units are incremental, the ones the promotion actually bought you.
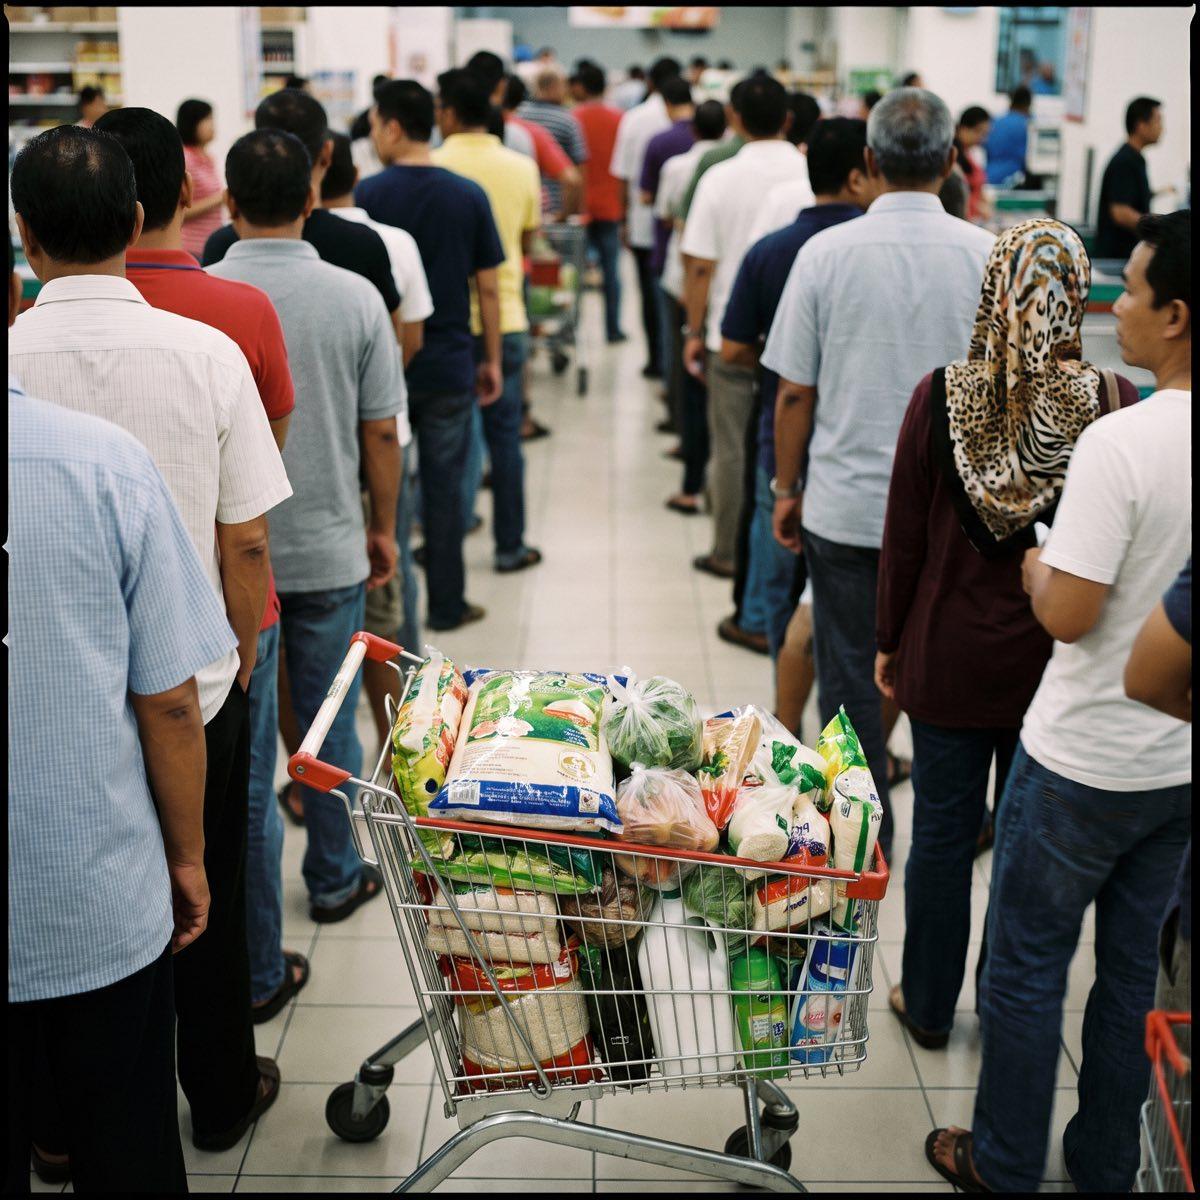
Second, how many units did you discount? All 20,000. Including the 12,000 that were coming to you at full price.
Do the full sum
| Incremental units | 8,000 |
| Margin per unit during promo (RM 4.00 − RM 2.50) | RM 1.50 |
| Incremental gross profit | RM 12,000 |
| Baseline units subsidised | 12,000 |
| Discount per baseline unit | RM 2.50 |
| Baseline subsidy, pure cost | RM 30,000 |
| Net result | −RM 18,000 |
A promotion that grew units 67 percent destroyed RM 18,000 of gross profit. Total discount given away was RM 50,000 and it generated RM 12,000 of incremental gross profit, a return of 0.24. Every ringgit of promotional depth came back as twenty-four sen.
And this is the flattering version. It ignores forward buying, where the trade loads up cheap and skips your next order. It ignores cannibalisation of your own full-price SKUs. It ignores the fact that repeated depth teaches shoppers your real price is the deal price.
Why it keeps happening
Because the promotion is measured on the wrong number. Units versus last week is a headline that always flatters depth. The right measure is incremental profit versus what you would have earned doing nothing, and doing nothing means the baseline.
Getting the baseline right is the hardest number in the room, and most teams do not have clean sell-out data to build one. In order of preference:
- Same weeks last year, de-seasonalised and adjusted for distribution changes.
- Pre- and post-promotion non-promo run rate, excluding the dip immediately after, because that is the pantry-loading hangover rather than real demand.
- Sell-in adjusted for pipeline fill. The weakest option, because sell-in during a promo week is inflated by trade stocking, not consumption.
State which one you used. A promotion ROI with an undeclared baseline is not an analysis, it is a hope.
The three fixes that actually work
Change the mechanic before you change the depth. Depth on every unit is the most expensive way to buy volume, because baseline shoppers self-serve it. Mechanics with a gate, such as a minimum basket, multibuy, bundle or gift with purchase, make the shopper do something to earn the discount. In the example above, a 15 percent deal gated behind a two-unit minimum can beat a straight 25 percent cut on both volume and profit.
Know who is actually funding the depth. On a marketplace during a 9.9 or 11.11 event, the shelf-facing discount is often part platform voucher and part your own off-invoice contribution. If the platform co-funds half, your real outlay on that 25 percent is 12.5 percent, but so is your commission, your free-shipping contribution and your ad burn, and those rarely make it onto the ROI slide. Model the money you actually pay, on both sides.
Protect the reference price. Depth resets what shoppers think your product is worth. Display and visibility do not. A shopper who sees you at RM 7.50 every third week has learned that RM 10.00 is the sucker price. Buy visibility, feature and quality of display before you buy price. The first builds demand, the second rents it.
The question for your next promo review
How much profit did this deliver versus doing nothing, and how much of the discount went to people who had already decided to buy us?Not: how many units did we sell
If the answer to the second half is most of it, you did not run a promotion. You ran a giveaway with a barcode.
See what your promo months really earned Heavy discount months show up in your own P&L as a falling average selling price against a flat gross margin percentage. Upload twelve months and the analysis puts both on the same chart, month by month.
Check my promo months